
Lab Results: Turbidity and pH
- vincentpolhemus
- Dec 1, 2018
- 2 min read

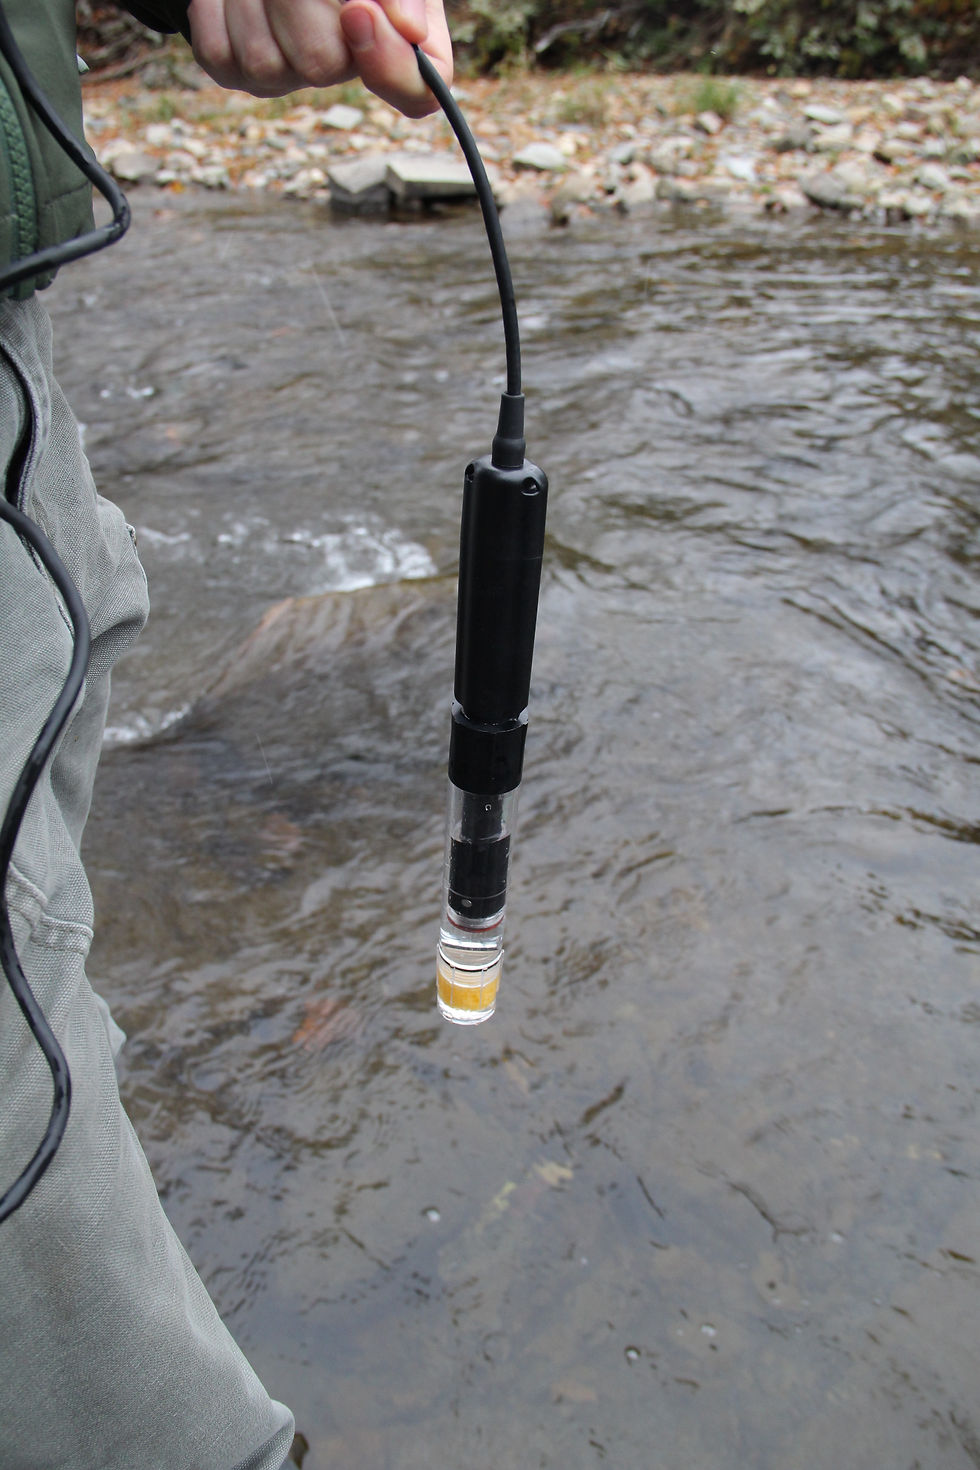
Now that all the samples have been taken we brought the water back to the lab. All 9 sites were tested using a Hach Spectrophotometer for phosphate, nitrate, pH and turbidity levels. Since some of the samples were not taken on the same day it is hard to compare them. However, the days we took the samples were somewhat similar with a week since the previous rain event and cold temperatures. One of the days we attempted to test it turned out to be a torrential down pour. This made the turbidity very high at the site we tested which was then re tested at a later date when the river calmed down. Once in the lab we discovered that all of the pH values were very similar and close to neutral. All of the sites were between 7.1-7.9 which is a good value for streams since the United States Fish and Wildlife say Brook Trout best live in pH values of 6.5-8.

For turbidity the values didn’t follow the path we thought they would. The origin of the Dog river was the clearest as expected but from there the values were odd. We figured the farther downstream the higher the turbidity, however this was not the case. Our results came out like a curve with values increasing until the middle of the river, dropping down a bit for a few sites and then being very low at the intersection of the Winooski. This could be caused by many different things but most likely was because not all samples were taken from the main channel of the river. Lower samples may have been taken from the edge where the water is slower, and particulates fell out. From here we will graph all of the data to establish trend curves and predict the cause of our results.


Comments